Skip to content
Welcome To Our Store.
100,000+ Products for Home, Medical, Office & Classroom Needs
Search
Skip to product information
1 of 1

Show Me the Numbers: Designing Tables and Graphs to Enlighten - Hardcover

$55.00 USD
$55.00 USD
Sale Sold out
Shipping calculated at checkout.

Available Offers

Fastest Delivery Tomorrow With Vip DealOrder within 1 hr 8 mins.

Instant 10% Discount On HDFC Banks Credit/Debit Cards EMI and CreditCard

Secure checkout with
  • American Express
  • Apple Pay
  • Diners Club
  • Discover
  • Google Pay
  • Mastercard
  • PayPal
  • Shop Pay
  • Visa

Flight Range: Up to 1,000 meters (3,280 feet)

Maximum Speed: 45 kilometers per hour (28 miles per hour)

For all orders exceeding a value of 100USD shipping is offered for free.

Returns will be accepted for up to 10 days of Customer’s receipt or tracking number on unworn items. You, as a Customer, are obliged to inform us via email before you return the item.

Otherwise, standard shipping charges apply. Check out our delivery Terms & Conditions for more details.

View Product Details
Shopping cart
Product Product subtotal Quantity Price Product subtotal
Show Me the Numbers: Designing Tables and Graphs to Enlighten - Hardcover
$55.00/ea
$0.00
Sold out
$55.00/ea $0.00

Product Description

by Stephen Few (Author)

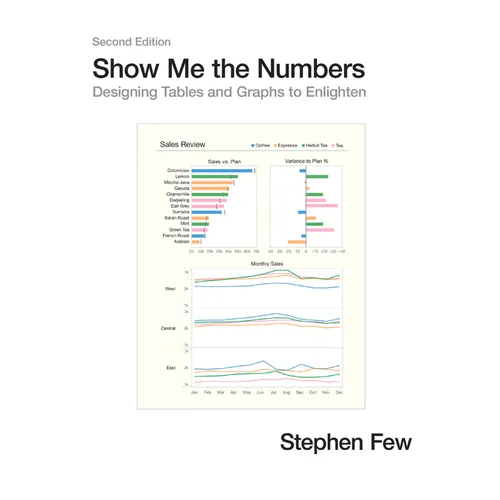
Addressing the prevalent issue of poorly designed quantitative information presentations, this accessible, practical, and comprehensive guide teaches how to properly create tables and graphs for effective and efficient communication. The critical numbers that measure the health, identify the opportunities, and forecast the future of organizations are often misrepresented because few people are trained to design accurate, informative materials, but this manual helps put an end to misinformation. This revised edition of the highly successful book includes updated figures and 91 additional pages of content, including new chapters about quantitative narrative and current misuses of graphs--such as donut, circle, unit, and funnel charts--and new appendices that cover constructing table lens displays and box plots in Excel and useful color palettes for presentation materials.

Author Biography

Stephen Few is the founder of the consultancy Perceptual Edge. He speaks, teaches, and consults around the world and writes the quarterly Visual Business Intelligence Newsletter. He is the author of Information Dashboard Design: The Effective Visual Communication of Data and Now You See It: Simple Visualization Techniques for Quantitative Analysis. He lives in Berkeley, California.


Number of Pages: 371
Dimensions: 1.3 x 11.2 x 8.7 IN
Illustrated: Yes
Publication Date: June 01, 2012
you might like