Product Description
by Diego Javier Zea (Author)
Represent and analyze data using Plots to find actionable insights using Julia programming
Key Features:
- Learn to use static and interactive plots to explore data with Julia
- Become well versed with the various plotting attributes needed to customize your plots
- Create insightful and appealing plots using data interactions, animations, layouts, and themes
Book Description:
The Julia programming language offers a fresh perspective into the data visualization field.
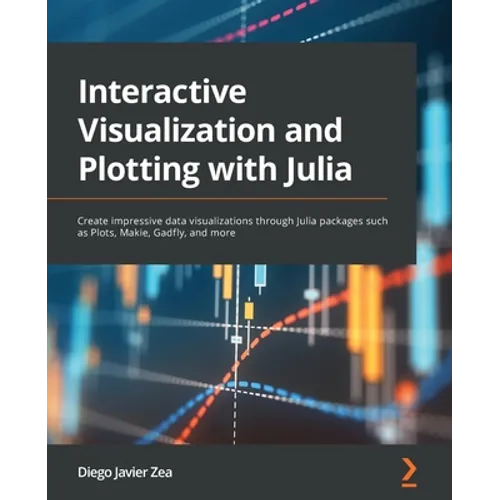
Interactive Visualization and Plotting with Julia begins by introducing the Julia language and the Plots package. The book then gives a quick overview of the Julia plotting ecosystem to help you choose the best library for your task. In particular, you will discover the many ways to create interactive visualizations with its packages. You'll also leverage Pluto notebooks to gain interactivity and use them intensively through this book. You'll find out how to create animations, a handy skill for communication and teaching. Then, the book shows how to solve data analysis problems using DataFrames and various plotting packages based on the grammar of graphics. Furthermore, you'll discover how to create the most common statistical plots for data exploration. Also, you'll learn to visualize geographically distributed data, graphs and networks, and biological data. Lastly, this book will go deeper into plot customizations with Plots, Makie, and Gadfly-focusing on the former-teaching you to create plot themes, arrange multiple plots into a single figure, and build new plot types.
By the end of this Julia book, you'll be able to create interactive and publication-quality static plots for data analysis and exploration tasks using Julia.
What You Will Learn:
- Create interactive plots with Makie, Plots, Jupyter, and Pluto
- Create standard statistical plots and visualize clustering results
- Plot geographically distributed and biological data
- Visualize graphs and networks using GraphRecipes and GraphPlots
- Find out how to draw and animate objects with Javis, Plots, and Makie
- Define plot themes to reuse plot visual aspect customizations
- Arrange plots using Plots, Makie, and Gadfly layout systems
- Define new plot types and determine how Plots and Makie show objects
Who this book is for:
Data analysts looking to explore Julia's data visualization capabilities will find this book helpful, along with scientists and academics who want to generate and communicate knowledge and improve their teaching material. This data visualization book will also interest Julia programmers willing to delve into the language plotting ecosystem and improve their visualization skills. Basic programming knowledge is assumed - but the book will introduce you to Julia's important features. Familiarity with mathematical and statistical concepts will help you make the most of some of the chapters.