Skip to content
Welcome To Our Store.
100,000+ Products for Home, Medical, Office & Classroom Needs
Search
Skip to product information
1 of 1

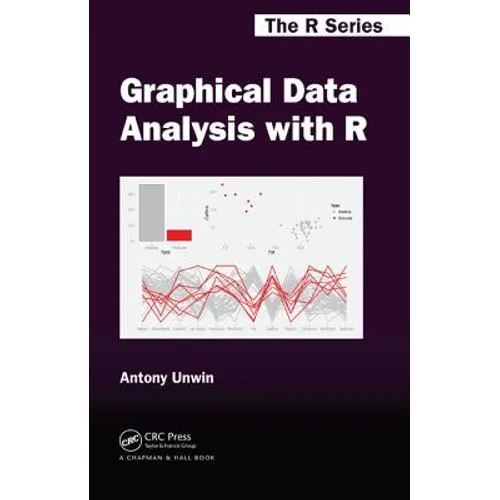
Graphical Data Analysis with R - Hardcover

$170.08 USD
$170.08 USD
Sale Sold out
Shipping calculated at checkout.
In stock (100 units), ready to be shipped

Available Offers

Fastest Delivery Tomorrow With Vip DealOrder within 1 hr 8 mins.

Instant 10% Discount On HDFC Banks Credit/Debit Cards EMI and CreditCard

Secure checkout with
  • American Express
  • Apple Pay
  • Diners Club
  • Discover
  • Google Pay
  • Mastercard
  • PayPal
  • Shop Pay
  • Visa

Flight Range: Up to 1,000 meters (3,280 feet)

Maximum Speed: 45 kilometers per hour (28 miles per hour)

For all orders exceeding a value of 100USD shipping is offered for free.

Returns will be accepted for up to 10 days of Customer’s receipt or tracking number on unworn items. You, as a Customer, are obliged to inform us via email before you return the item.

Otherwise, standard shipping charges apply. Check out our delivery Terms & Conditions for more details.

View Product Details
Shopping cart
Product Product subtotal Quantity Price Product subtotal
Graphical Data Analysis with R - Hardcover
$170.08/ea
$0.00
$170.08/ea $0.00

Product Description

by Antony Unwin (Author)

See How Graphics Reveal Information

Graphical Data Analysis with R shows you what information you can gain from graphical displays. The book focuses on why you draw graphics to display data and which graphics to draw (and uses R to do so). All the datasets are available in R or one of its packages and the R code is available at rosuda.org/GDA.

Graphical data analysis is useful for data cleaning, exploring data structure, detecting outliers and unusual groups, identifying trends and clusters, spotting local patterns, evaluating modelling output, and presenting results. This book guides you in choosing graphics and understanding what information you can glean from them. It can be used as a primary text in a graphical data analysis course or as a supplement in a statistics course. Colour graphics are used throughout.

Author Biography

Antony Unwin is a professor of computer-oriented statistics and data analysis at the University of Augsburg. He is a fellow of the American Statistical Society, co-author of Graphics of Large Datasets, and co-editor of the Handbook of Data Visualization. His research focuses on data visualisation, especially in interactive graphics. His research group has developed several pieces of interactive graphics software and written packages for R.

Number of Pages: 312
Dimensions: 0.7 x 9.4 x 6.1 IN
Illustrated: Yes
Publication Date: May 20, 2015
you might like